

Gauss Surgical
Analytics Dashboard
The Triton dashboard allowed our internal team to setup hospitals and healthcare systems onto the Triton platform, as a Saas application. From the dashboard our clinical or engineering teams could activate/deactivate accounts, upgrade accounts, diagnose app issues, and analyze usage metrics.
Role
Product Designer
Tools
Figma
Objective

The old Triton dashboard was incredibly difficult for a user to navigate through to find the right information for a hospital or healthcare system. Many interactions caused pages to break, search functionality didn’t populate proper results, and the overall our Engineering and Clinical always felt discouraged using the dashboard.
Gauss needed a dashboard that had different user profiles with specific permissions to easily enable and diagnose devices for hospitals and health systems.
KPIs:
Reduce time spent troubleshooting
Reduce device activation times
Improve user sentiment
Shadowing & Interviews
I conducted shadowing sessions with the engineering team and the clinical team to begin documenting their flow with the initial dashboard to understand how they use it and what other tools they may reference while using it.
Afterwards, I would do an informal interview with each user on aspects of their use to determine what information could be grouped together, their ideal state of how to navigation, data that informed decision making, and potential desired features.
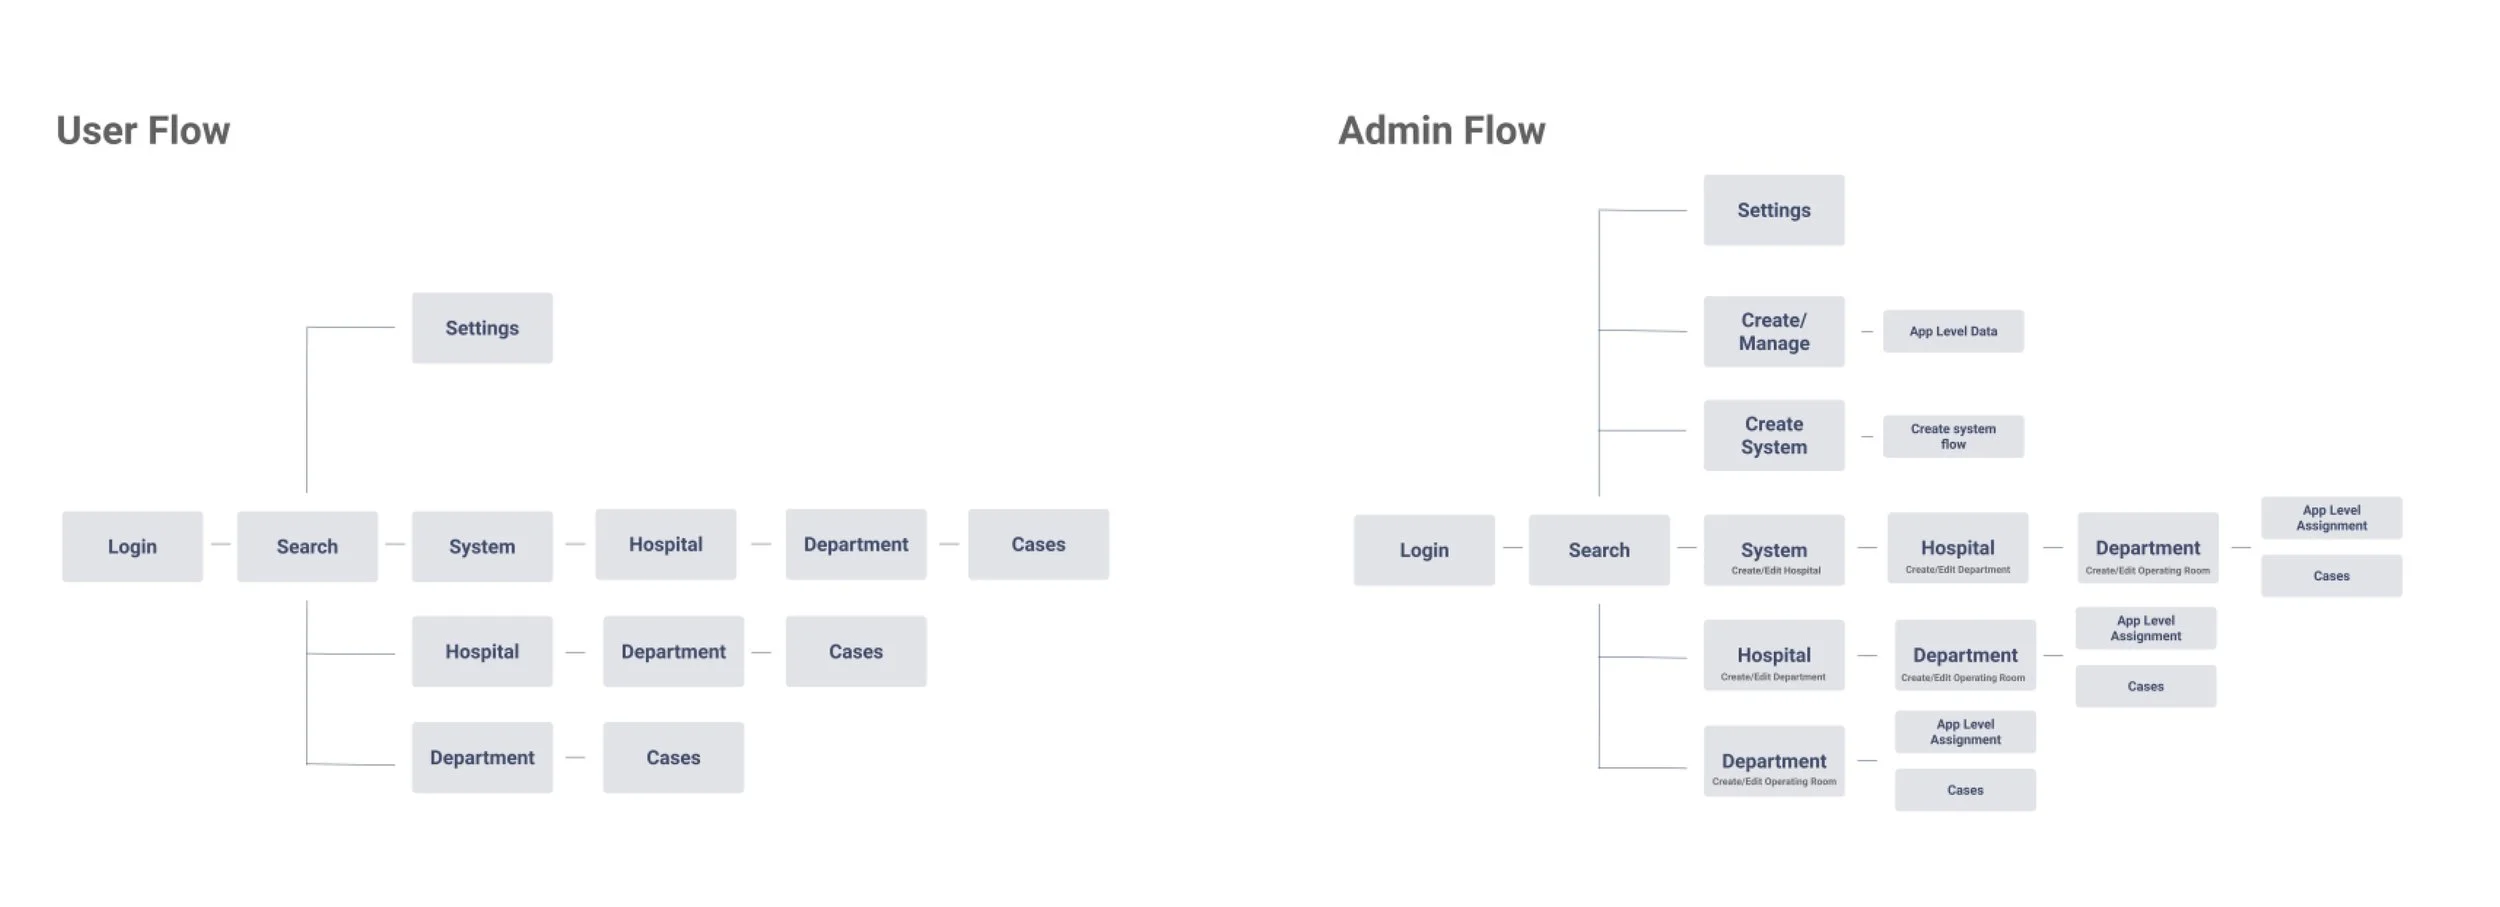
From here I was able to establish particular user flows for the clinical team (users) and the software engineering team (admin).
Dashboard designs
Since this was an internal dashboard I was able to connect with users early and often to simulate tree tests and continually iterate designs. I was able to receive positive sentiments about the grouping of images and data, and how the inclusion of usage rates by month (30 days) was useful in helping make clinical decisions.


Handoff
I worked with an external front-end development agency to go through the wireframes and prototypes and walk through flow features and functionality.
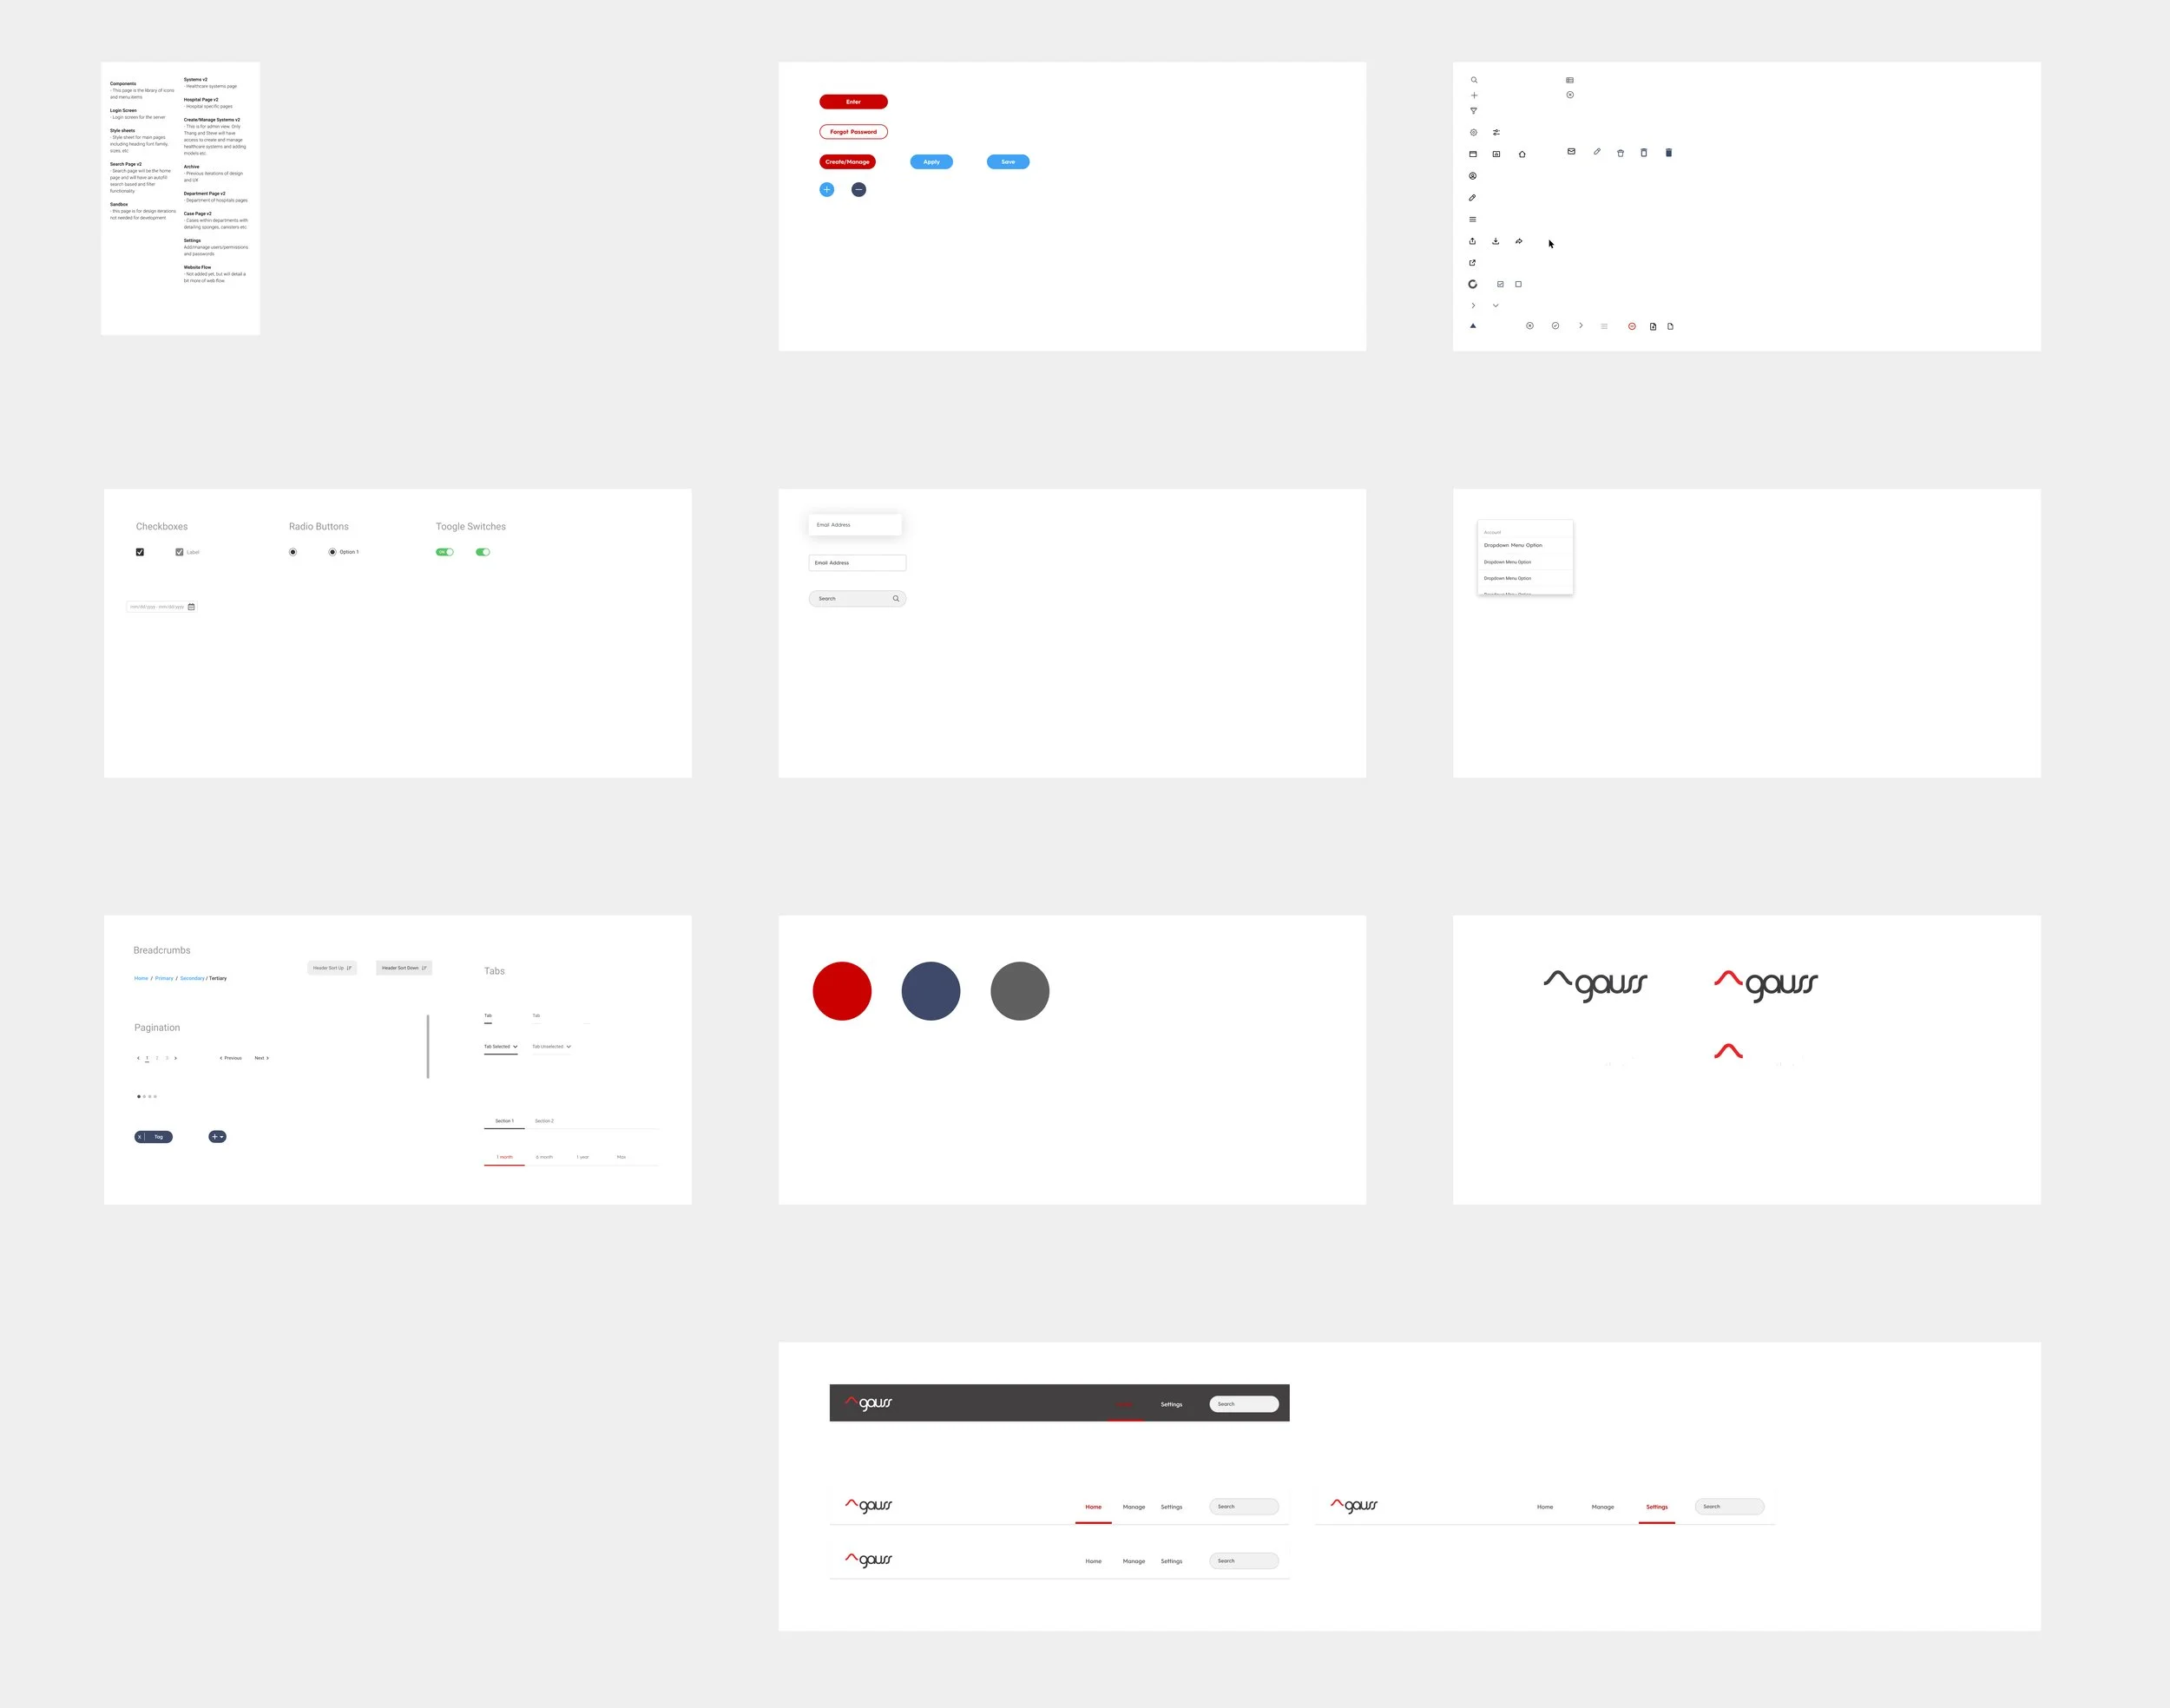
I established Figma documentation, component library and annotations for each of the wires to help the development process. This began as the base of an internal facing design system.
Results
Through the improved dashboard we were not only able to reduce time spent troubleshooting and activating devices, we also saw ways to use the data to enable our sales team to sell add-on services, which improved user satisfaction.